Making the most of K500: Compare models
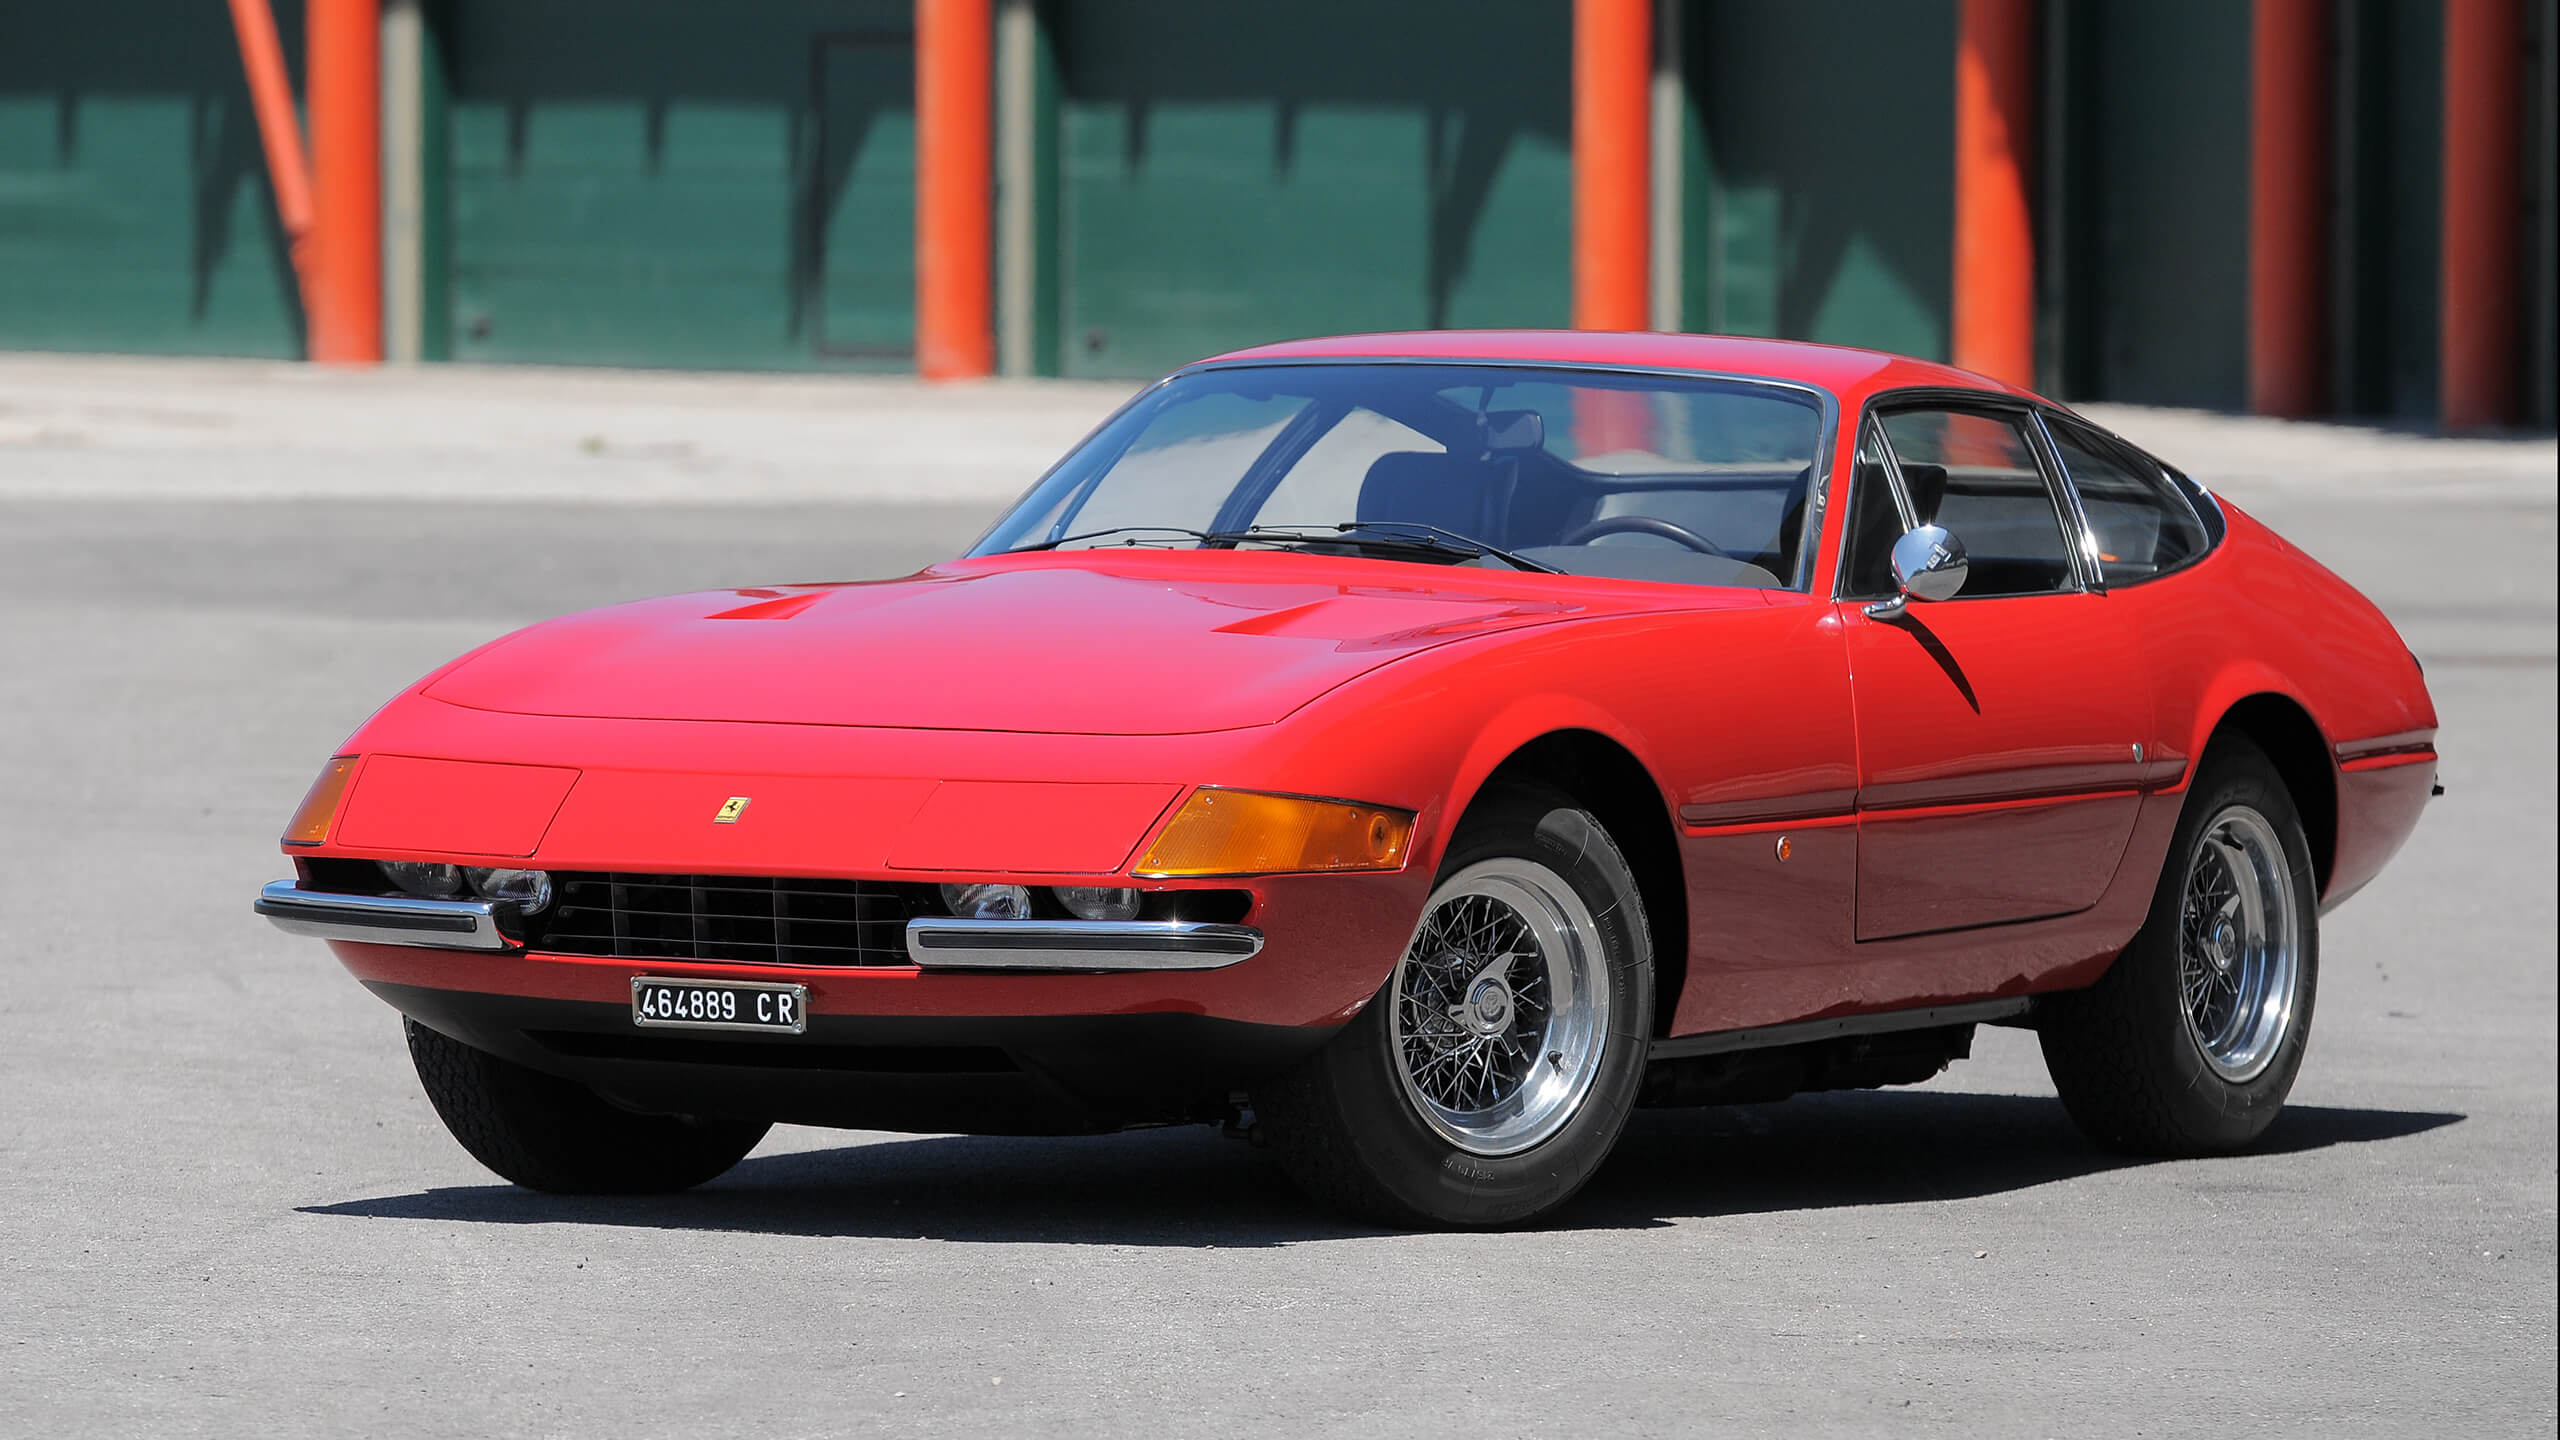
Need to judge prices of the Ferrari ‘Daytona’ against its great in-period rival the Maserati Ghibli? There’s only one way to find out: K500’s comparison tool.
All you need to do is log in, click on 'VIEW GRAPHS' at the top of the page to take you to https://k500.com/the-index then click on ‘BUILD YOUR OWN GRAPHS HERE’ (Please note, you'll need to be logged in for this box to appear.)
VALUES OF ‘DAYTONA’ VERSUS GHIBLI

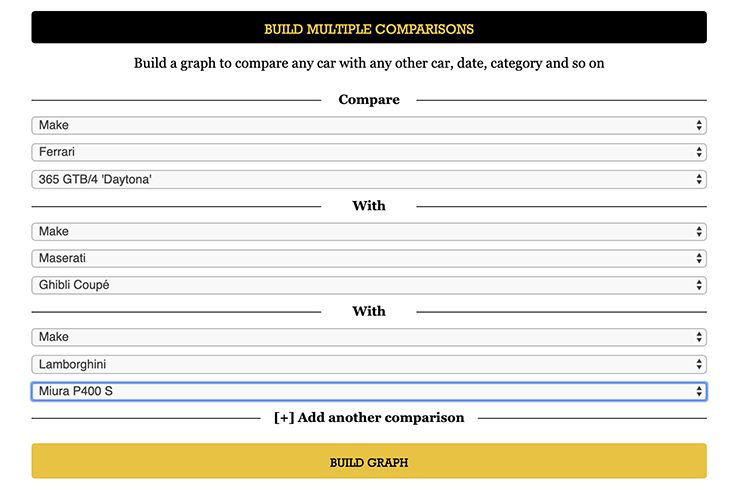
Then, choosing ‘BUILD MULTIPLE COMPARISONS’, you select ‘Ferrari’ as Make and ‘365 GTB/4 Daytona’ as Model. Do the same for ‘Maserati’ and ‘Ghibli Coupé’. Click on ‘BUILD GRAPH’ and K500 works out the relative performance of the two cars in the saleroom since 1994. You can, of course, add more; the Lamborghini Miura P400S would be a good one.
By adjusting the 'SHOW AUCTION DATA FROM' dropdown, the period studied can be changed from all-time - starting at 1994 - right down to just the previous 12 months.
EXAMPLE: VALUES OVER THE LAST FIVE YEARS
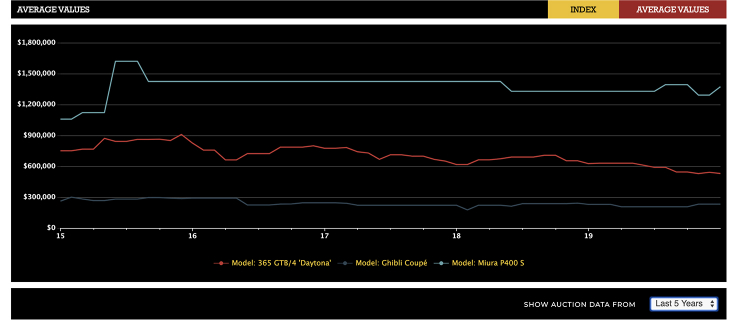
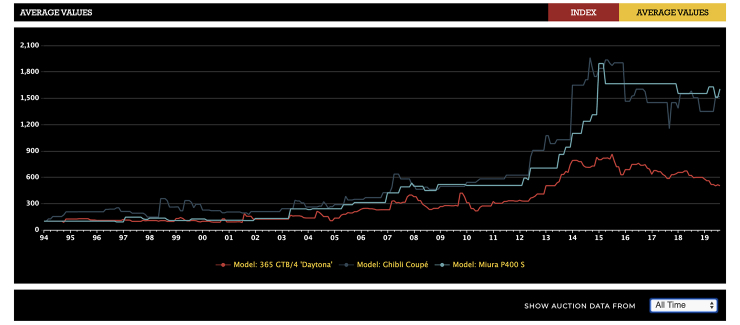
While the Daytona has always had a higher price than the Ghibli, the more affordable Maserati has held its value relatively steadily in recent years and could be seen retrospectively as a more reliable investment. This is clearly shown by switching between ‘AVERAGE VALUES’ and ‘INDEX’ on the graph you’ve built. The INDEX gives a starting point of 100 for every model and shows how prices have evolved since 1994. Meanwhile, Sant’Agata’s supercar has dropped slightly since the peak in 2015, but holds its own today.
STABILITY OF VALUES - A STARTING POINT OF 100 FOR EVERY CAR
Stories