Monterey 2021: All the numbers
After a two-year hiatus, the Big Three auction houses were back holding live events on the Monterey Peninsula. Whether it was a consequence of offering fewer, better cars or just the feel-good factor of an increasingly post-pandemic world, the results were the strongest for the last few years.
Compared with 2019, the combined gross for the Big Three has jumped by 35%. With fewer, better-quality cars offered, the average price per car sold increased by 44%. For those fortunate enough to attend the event, it felt buoyant – the figures prove it.
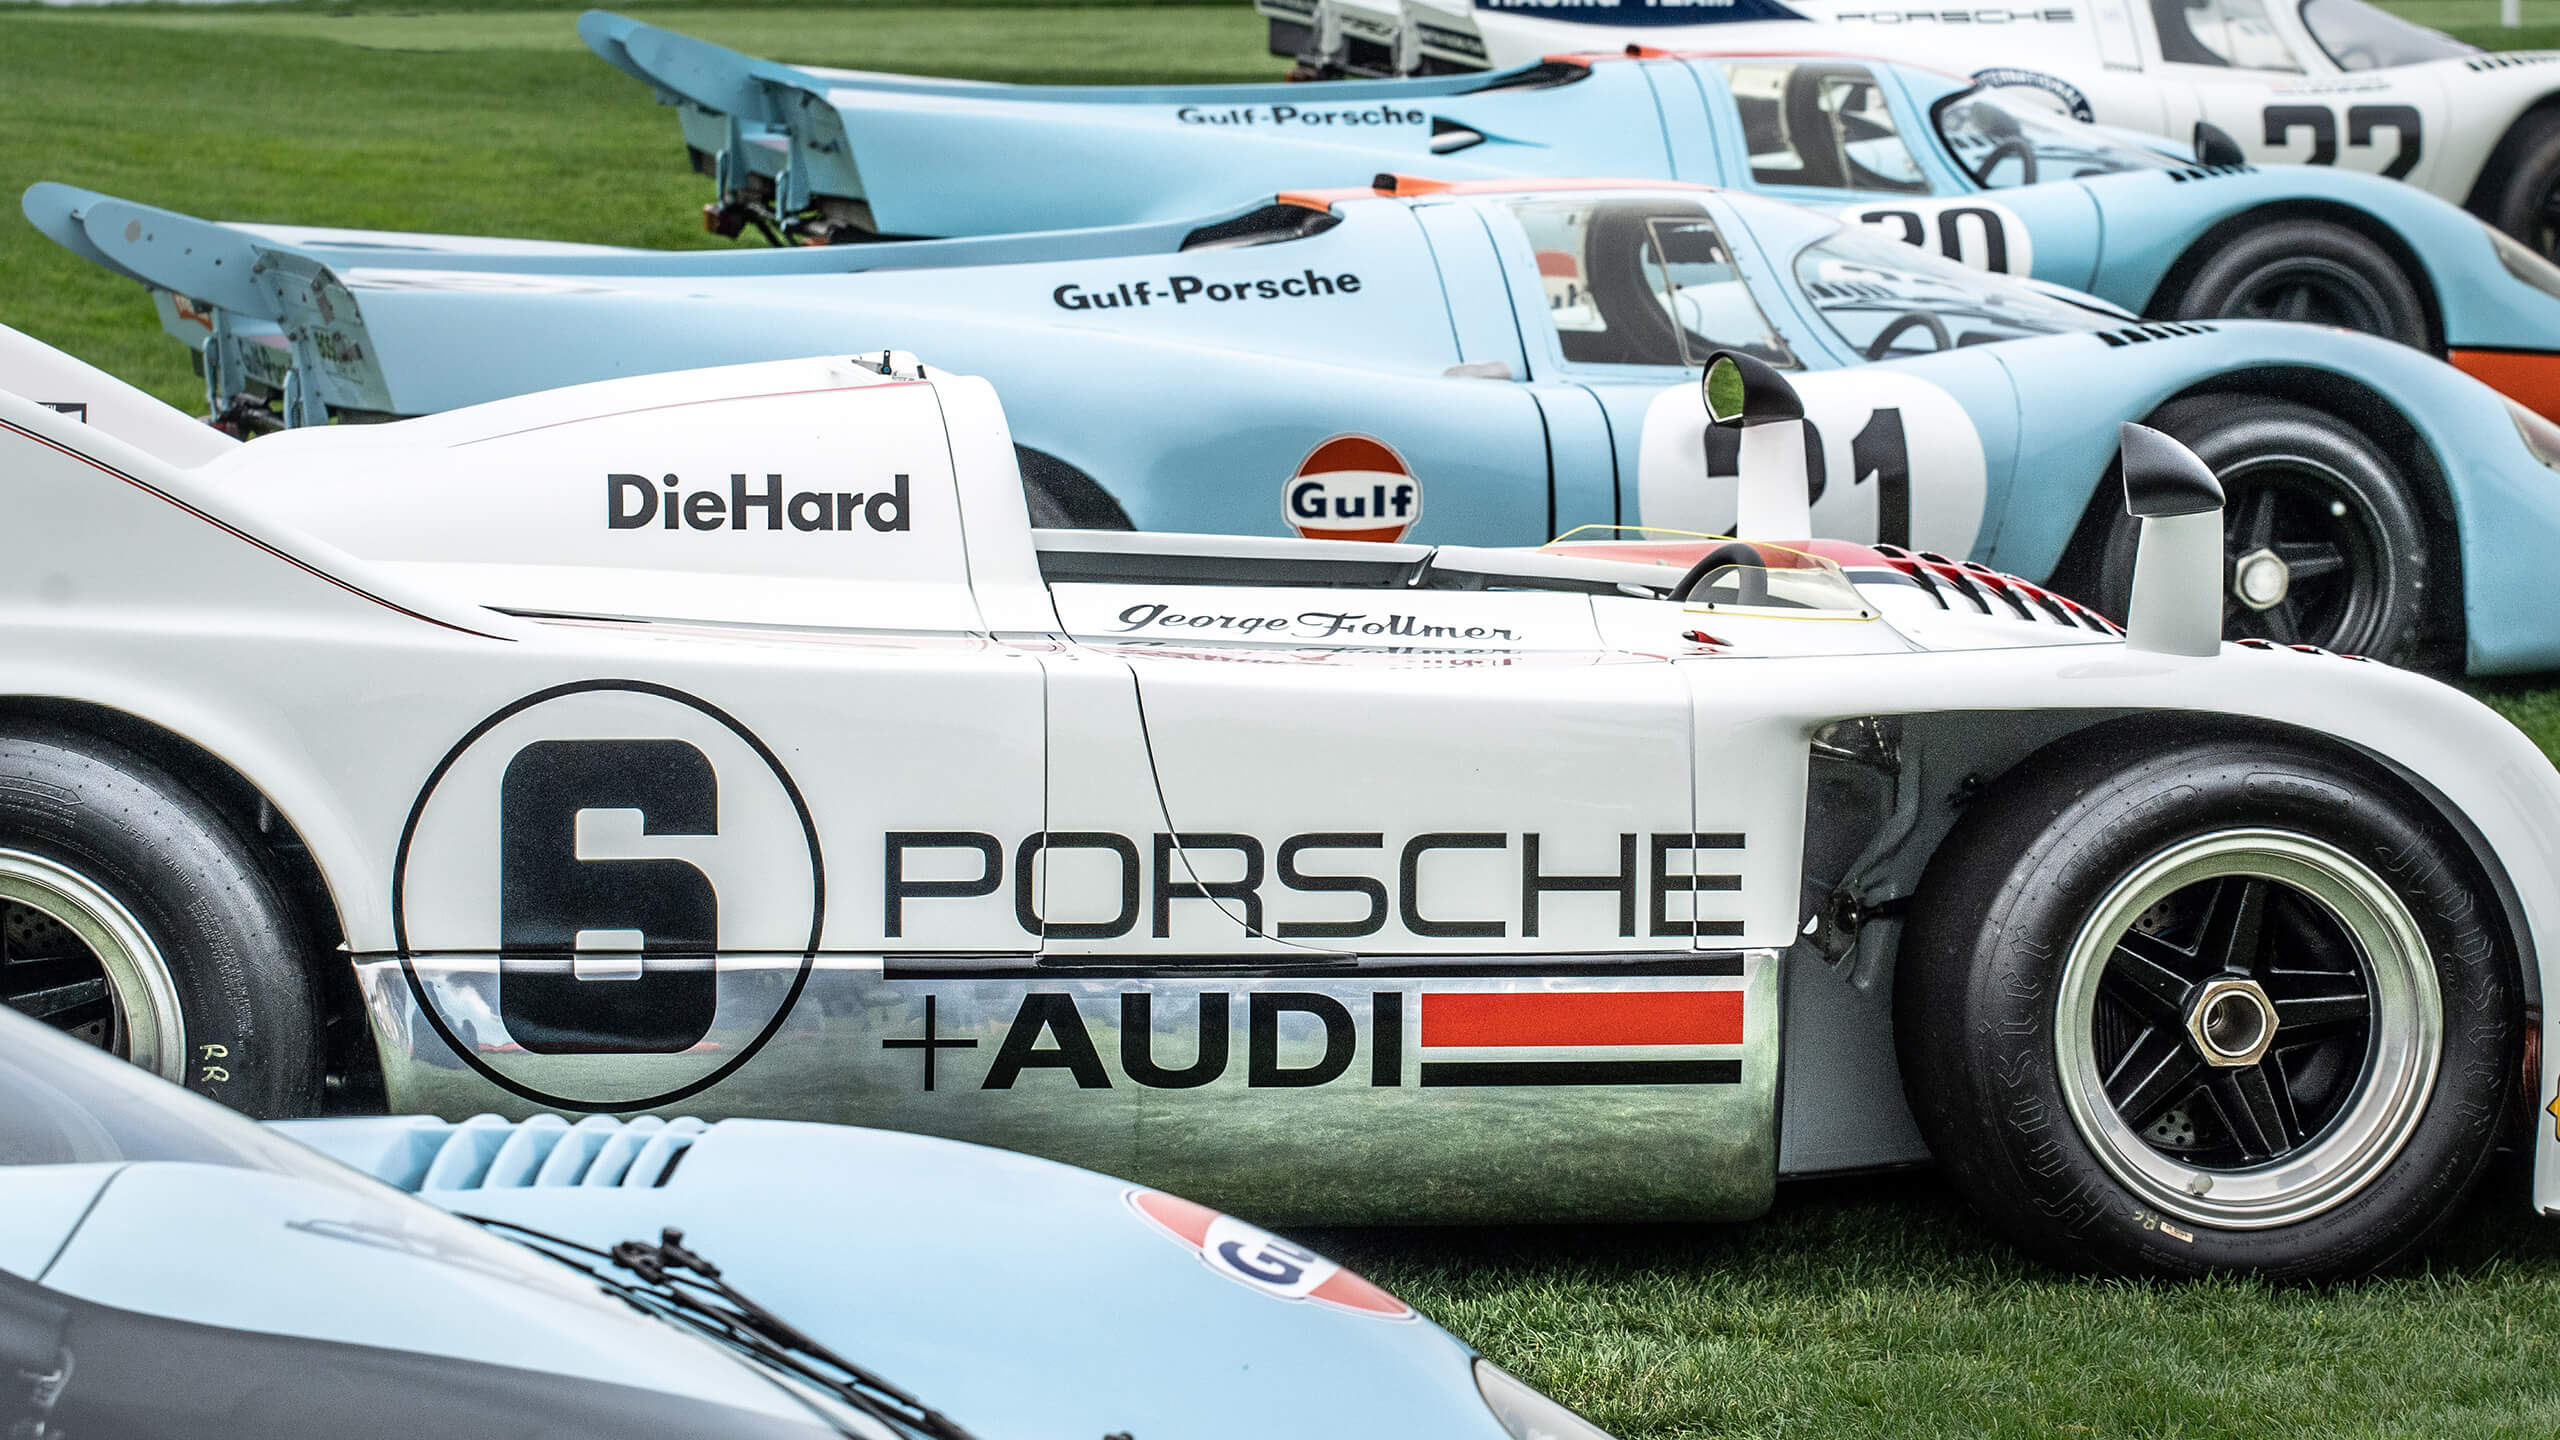
Other metrics – 27% of cars beating top estimate, number sold at $1m+, sell-through by number – have all improved. Only the total for the Top 10 sold over the week has not shown much progress, a function of headliners such as RM’s Gulf Porsche 917K failing to sell.
Since K500 started in 2014, the highest figure recorded for Monterey Week auctions held by the Big Three is a combined gross of $356,616,250. That was in 2014, approaching the peak of the recent market, when 90% sold by number.
You can download a list of all cars sold by Bonhams, Gooding & Co and RM Sotheby's sorted by make and model HERE.
Monterey Week Sales 2021 – Bonhams, RM Sotheby’s, Gooding combined (2019)
Gross: $291,150,333 ($216,053,690)
Number of cars not sold: 47 (134)
Number of cars withdrawn: 1 (4)
Total number of cars: 430 (543)
Number sold: 383 (409)
Percentage cars sold by number: 89% (75%)
Percentage by value average low/high estimate: 69% (48%)
Percentage of cars met or sold below low estimate: 38% (76%)
Percentage of cars sold below avge of estimates: 59% (88%)
Percentage of cars sold met/exceeded top estimate: 27% (7%)
Average price of cars sold: $760,184 ($528,249)
Average year of cars offered: 1967 (1967)
Percentage of cars offered at No Reserve: 50% (48%)
Monterey Week Sales 2021, Top 10 Cars Sold by Value
1. Gooding 1995 McLaren F1 $20,465,000
2. Gooding 1959 Ferrari 250 GT LWB California Spider Competizione $10,840,000
3. RM 1962 Aston Martin DB4 GT Zagato $9,520,000
4. RM 1962 Ferrari 268 SP $7,705,000
= 4. RM 1966 Ferrari 275 GTB Competizione $7,705,000
6. RM 1958 Ferrari 250 GT LWB Berlinetta 'Tour de France' $6,000,000
7. Gooding 1929 Bugatti Type 35B Grand Prix $5,615,000
8. Bonhams 1928 Mercedes-Benz 26/120/180-S-Type $5,395,000
9. Gooding 1958 Ferrari 250 GT Series I Cabriolet $4,405,000
10. RM 1963 Shelby 289 Cobra Works $4,130,000
Top 10 total: $ $81,780,000 (2019, $78,545,000)
Number of cars sold over $1m: 72 (2019, 42)
Bonhams at Quail Lodge, 13 August 2021 (2019)
Gross: $35,937,770 ($31,410,840)
Number of cars not sold: 15 (53)
Number of cars withdrawn: 0 (4)
Total number of cars: 139 (219)
Number sold: 124 (166)
Percentage cars sold by number: 89% (76%)
Percentage by value average low/high estimate: 70% (45%)
Percentage of cars met or sold below low estimate: 38% (81%)
Percentage of cars sold below avge of estimates: 62% (93%)
Percentage of cars sold met/exceeded top estimate: 22% (4%)
Average price of cars sold: $289,821 ($189,222)
Average year of cars offered: 1967 (1964)
Percentage of cars offered at No Reserve: 56% (56%)
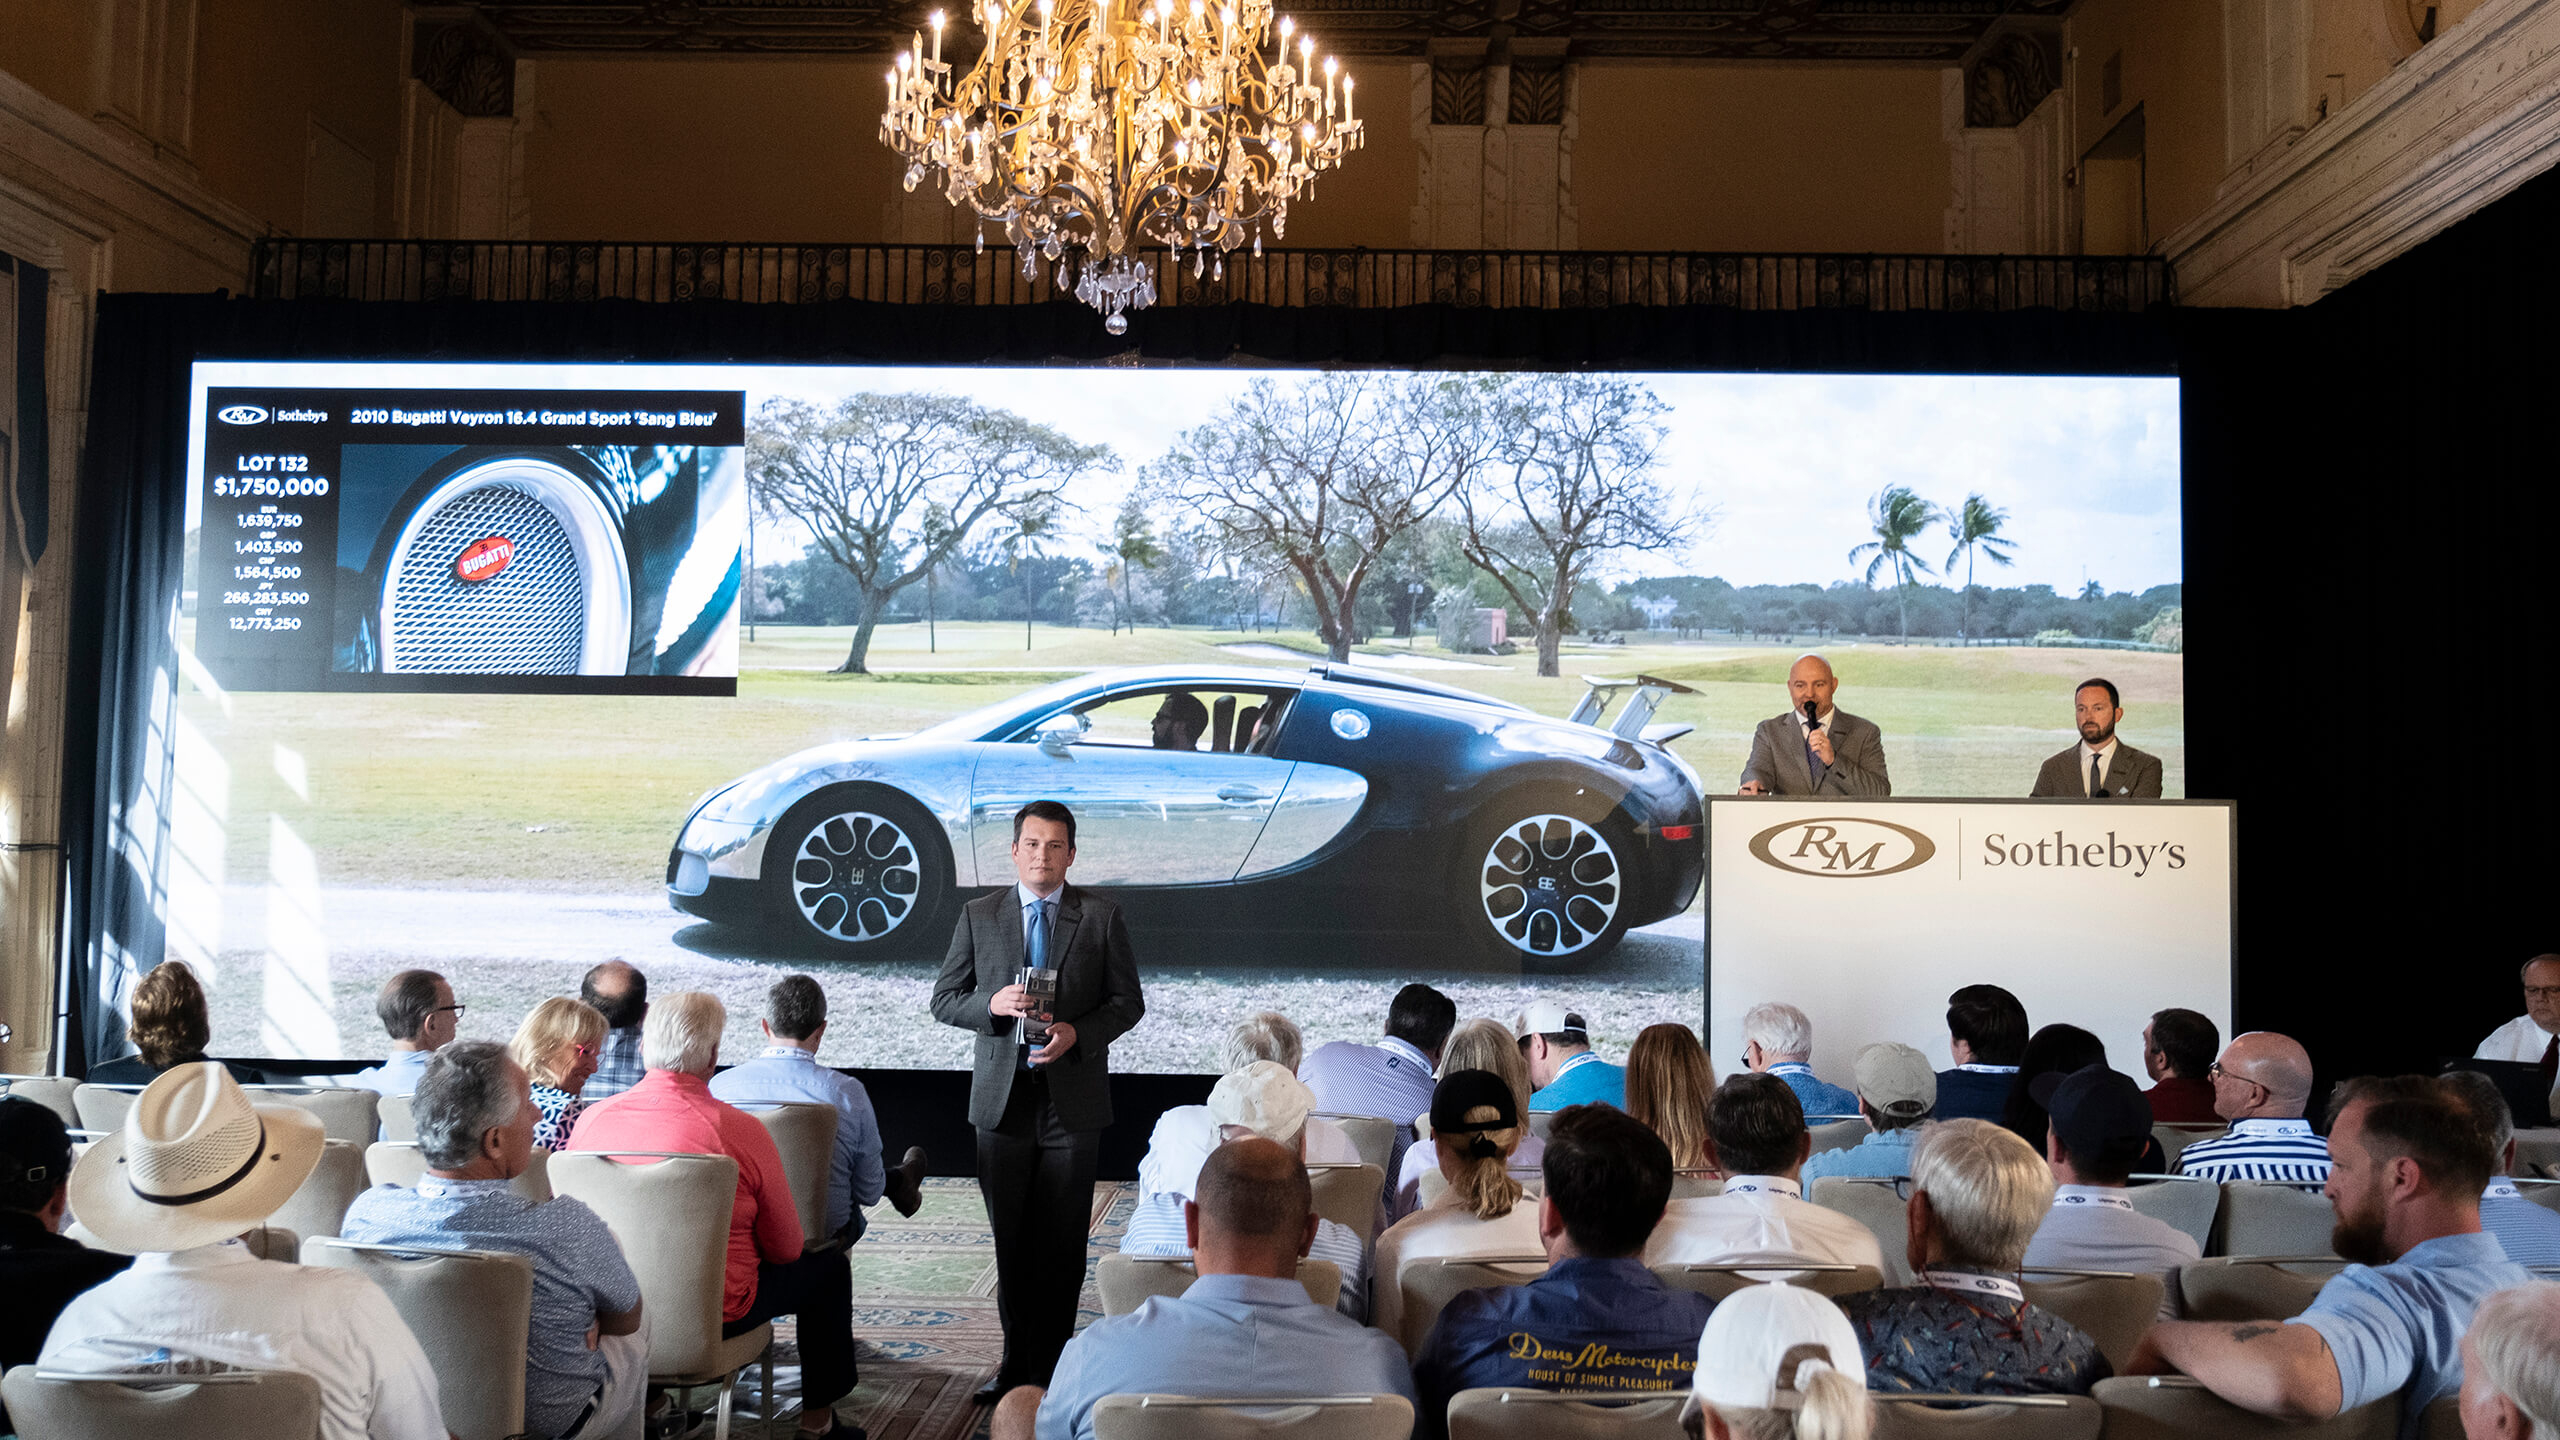
RM Sotheby’s at the Monterey Conference Center, 12 - 14 August 2021 (2019)
Gross: $148,407,802 ($107,818,110)
Number of cars not sold: 15 (49)
Number of cars withdrawn: 1 (0)
Total number of cars: 162 (184)
Number sold: 147 (135)
Percentage cars sold by number: 91% (73%)
Percentage by value average low/high estimate: 63% (47%)
Percentage of cars met or sold below low estimate: 37% (64%)
Percentage of cars sold below avge of estimates: 58% (75%)
Percentage of cars sold met/exceeded top estimate: 28% (11%)
Average price of cars sold: $1,009,577 ($798,653)
Average year of cars offered: 1970 (1974)
Percentage of cars offered at No Reserve: 48% (43%)
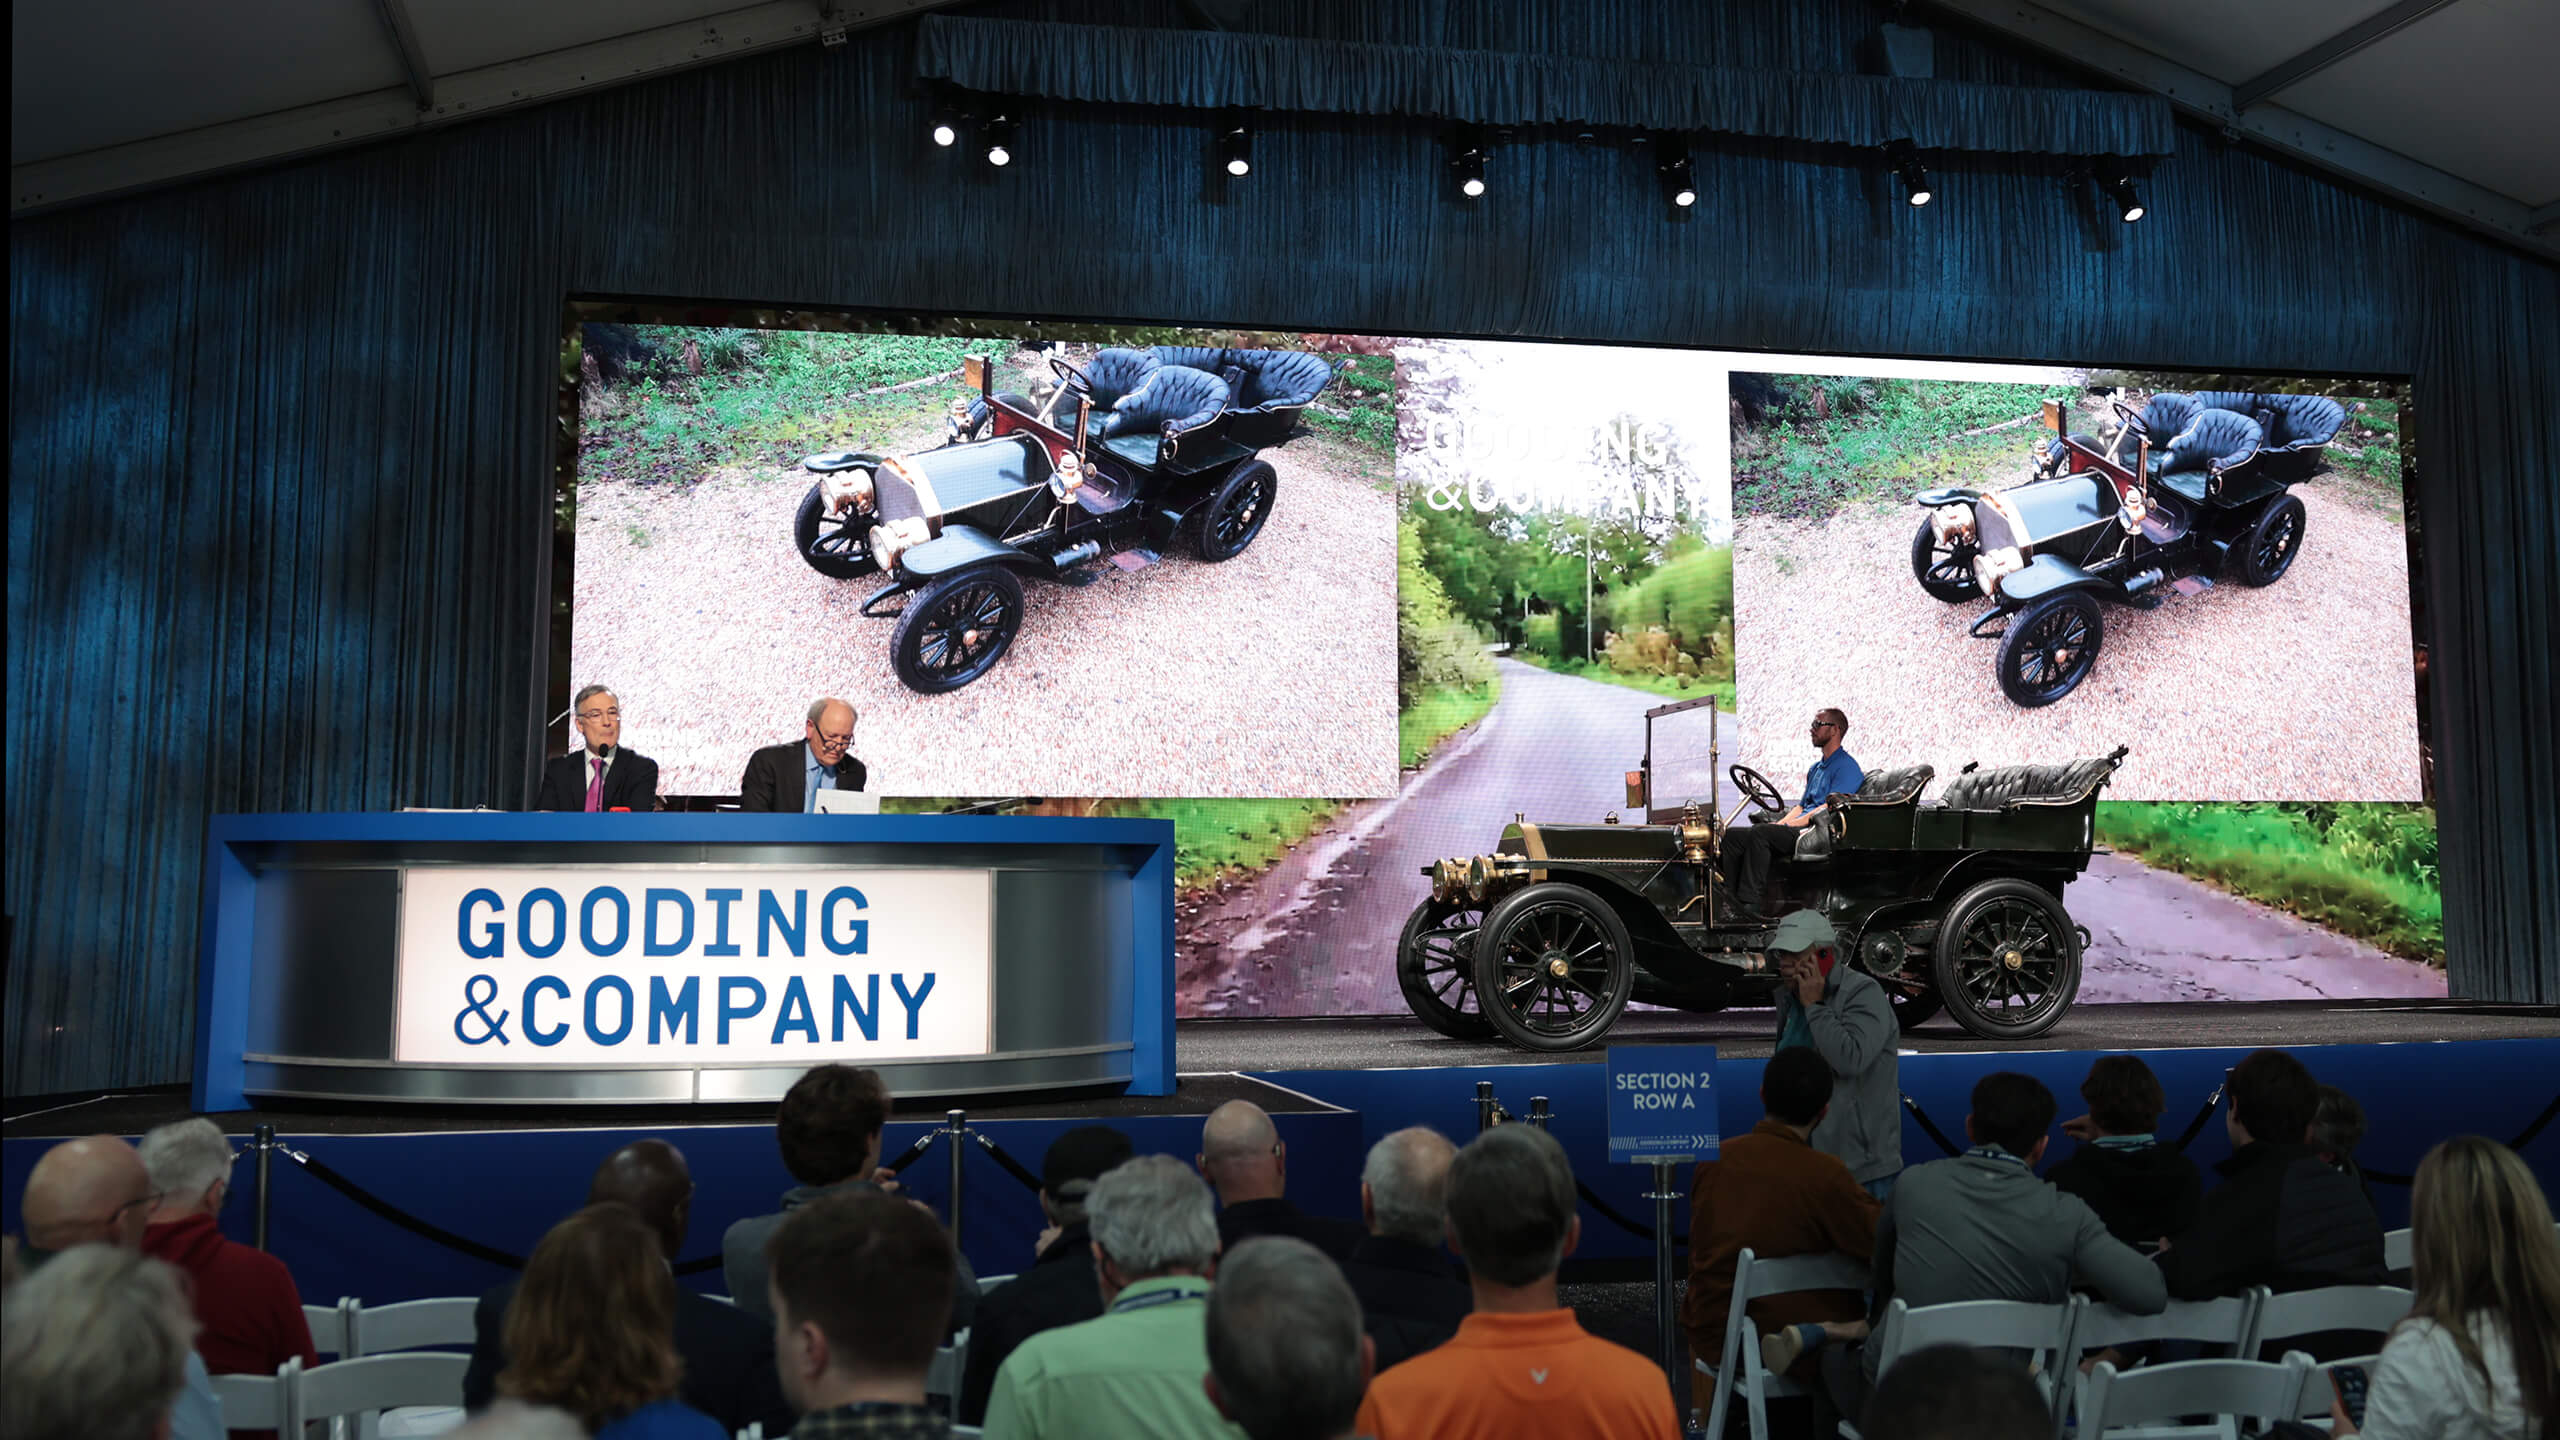
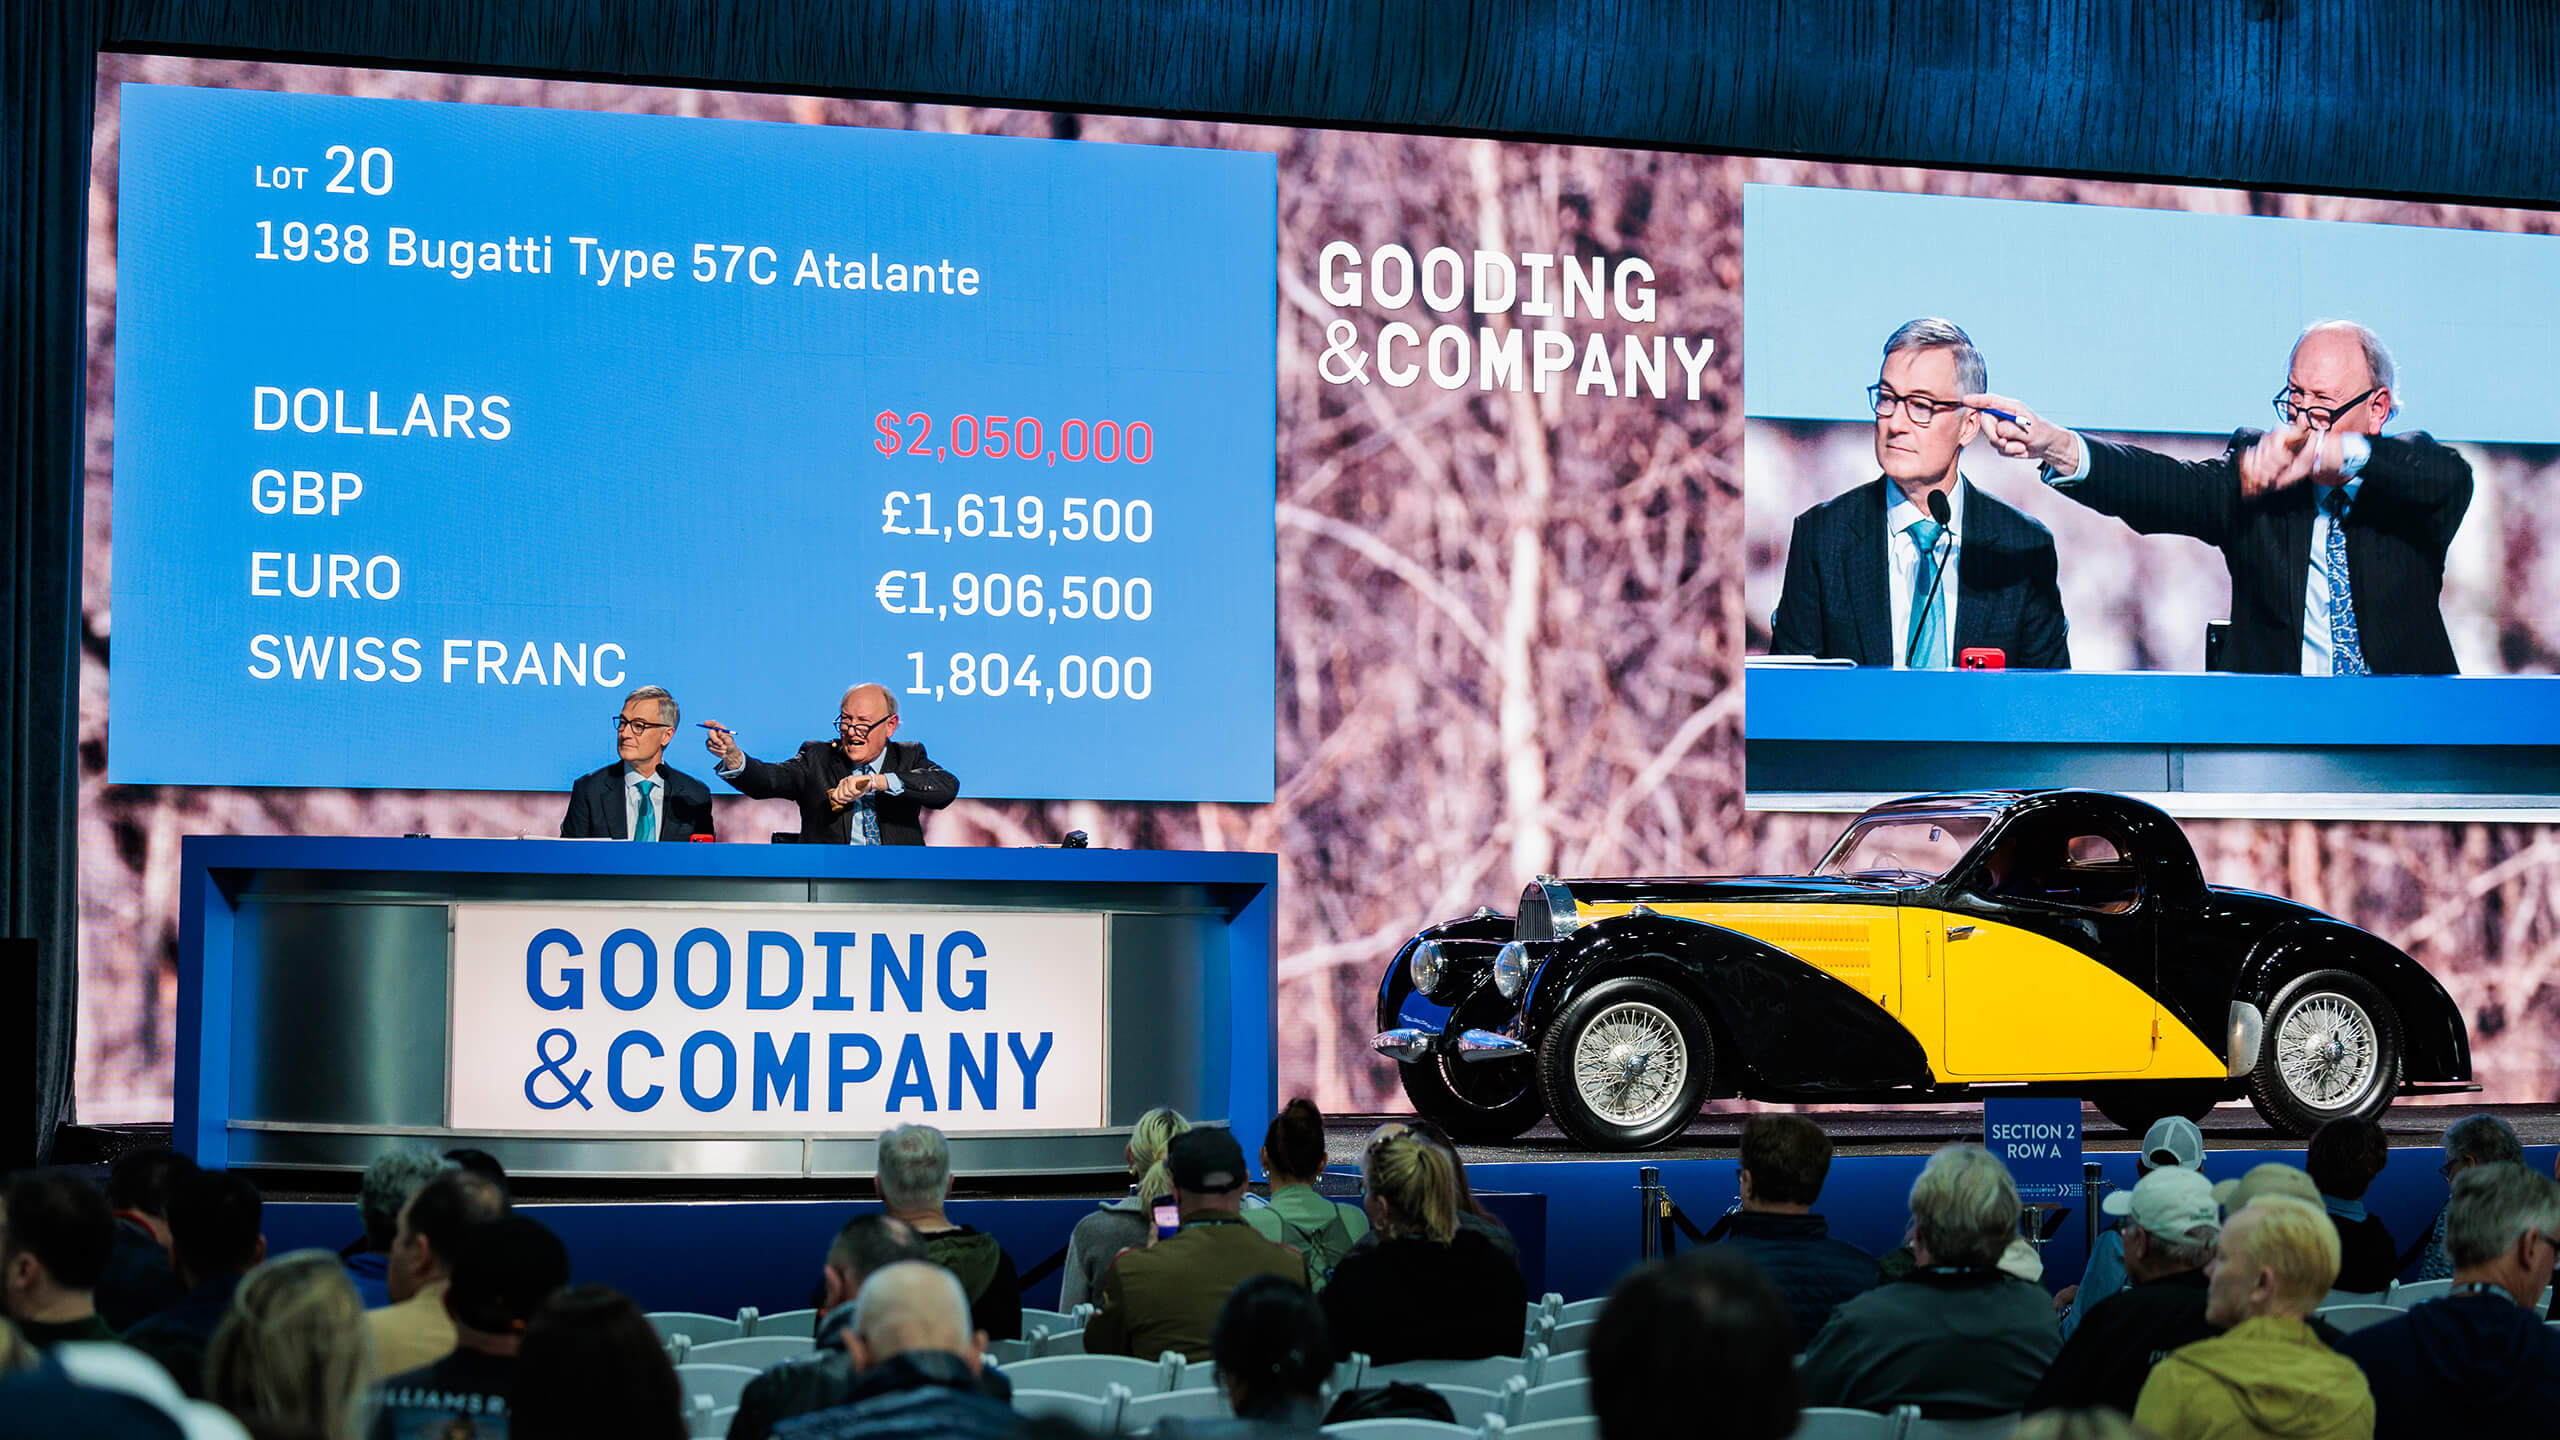
Gooding at Pebble Beach, 13 – 14 August 2021 (2019)
Gross: $106,798,761 ($76,824,740)
Number of cars not sold: 17 (32)
Number of cars withdrawn: 0 (0)
Total number of cars: 129 (140)
Number sold: 112 (108)
Percentage cars sold by number: 87% (77%)
Percentage by value average low/high estimate: 78% (51%)
Percentage of cars met or sold below low estimate: 41% (85%)
Percentage of cars sold below avge of estimates: 58% (95%)
Percentage of cars sold met/exceeded top estimate: 30% (4%)
Average price of cars sold: $953,560 ($711,340)
Average year of cars offered: 1961 (1963)
Percentage of cars offered at No Reserve: 45% (39%)
NOTE: Results exclude Automobilia but do include after-sale cars as of 16 August 2021
With thanks to Hammer Price
Photo by Tom O’Neal for Rolex
Stories