
How We Calculate The Index
The Index and Average Values graphing has been put together by a combination of classic car expertise and financial experience. We have brought in City specialists and deployed their proficiency in statistical analysis with our inside knowledge of the market.
Data in the K500 is taken from some 30,000 constantly growing auction results from over two decades of sales. We use verifiable saleroom transactions, rather than rumoured private deals, to ensure transparent, unbiased market data.
Each car in the K500 has been chosen for its historical and intrinsic interest to the collector, and only results from these cars are included in our Index and Average Values figures.
To represent the sheer volume of sales of some cars – for which not all data is available – some models and model sectors may be weighted, much as happens with financial indices to balance out stocks with a high volume of shares.
There will always be a degree of subjectivity, and consideration of the proportion of cars traded to total production is sometimes also allowed for.
Each car is allocated to a Market Sector, so Sector trends in similar cars or makes can be compared over time, both as an Index and as Average Values: Pre-War versus Post-War, or Ferrari versus Porsche for example.
For each car, a single dot represents one sale. The same car, of course, can be traded more than once, and K500 members can search by individual chassis number. The individual sales are extrapolated to show two curves: one for moving average sale value, the other for an exponential regression (ie the trend) of the moving average.
Every K500 car also has its own Index value shown on a separate graph that can be switched between Index and Average Values view.

Data from individual car sales is exported to the overall Index as a monthly average of the sector cars' moving averages, indexed back to 1994 = 100. Where there have been no sales of a car in a month, the car's previous month's average will be shown. Cars with a zero average sale value are excluded from the market sector calculation until they have enough sales to have a moving average value.
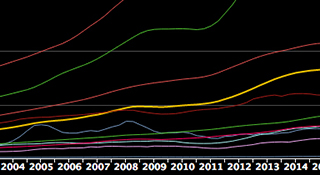
The Market Sectors are plotted as both an Index (baselined to 1994 = 100) and a market sector average price.
The overall K500 Index is calculated by averaging the monthly market sector indices from 1994 to present. Average Values are calculated the same way.
Our data team inputs auction results, many of which we witness personally, after the sales, with cross-checking of car identification numbers which auction houses often list inconsistently. The Index and Average Values are then updated to give you the latest picture.
